


And has been underperforming average global growth for 15 years.
Things are looking a lot brighter at the start of 2026 than they have in easily the past five years. Eskom is largely a solved problem (for now). Transnet is turning the corner, albeit painstakingly.
These network reforms by The Presidency (of which Eskom and Transnet, including the ports, are the two largest) are working.
The rand continues to strengthen against major currencies – particularly the US dollar as dollar weakness will no doubt be a theme for some time to come given some of the choices being made by the Trump administration.
Add to this that the prices of most of our biggest export commodities are at or near multi-year (if not all-time) highs.
The government of national unity, with all its faults, is stable.
ALSO READ: After exiting greylist, SA now also off European list of high-risk country jurisdictions
And South Africa is off the grey list, with rating agency S&P Global upgrading our sovereign credit rating in November 2025 for the first time in nearly two decades.
Despite all these positive signs, growth is expected to increase moderately to just 1.5% (the latest estimate from National Treasury) this year.
This is simply nowhere near enough to grow the economy in a meaningful way and to make even a dent in the unemployment crisis. Goldman Sachs Research expects global GDP to increase 2.8% this year. South Africa has been underperforming average – yes, average – global growth for 15 years now.
The last time we grew faster than the global average was in 2008 (3.2% versus 2.1%), thanks to both the 2010 Fifa World Cup construction and infrastructure boom as well as our exposure to the fallout from the global financial crisis being more limited than most.

The inconvenient truth is that South Africa dislocated from the trajectory of average global growth – never mind that of our emerging market peers – in 2009.
ALSO READ: GDP: Economy grew by only 0.5% in third quarter
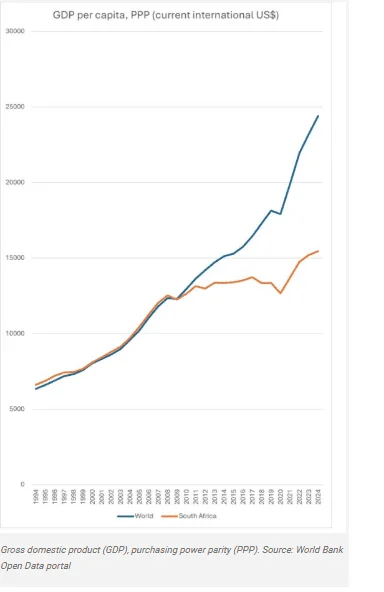
GDP per capita, which is our economic output divided by our population (adjusted for purchasing power parity or PPP) tells the painful story.
Put simply: the average South African today is roughly 63% as wealthy (on a PPP basis) as the average person globally. This is according to World Bank data. We simply haven’t kept up.
The reasons are largely well understood.
Poor economic policies (a kinder way of saying a lack of anything resembling a coherent economic policy), state capture, corruption, depressed commodity prices and a myriad of structural constraints have led to this.
In his annual letter to shareholders, FirstRand chair Johan Burger belabours the point that: “Real GDP growth of around 1% is below population growth (which is around 1.5%), leaving per capita income negative. Here the maths is brutal. Without faster growth, inequality and unemployment will remain entrenched.”
ALSO READ: World Bank slightly raises economic growth forecast for SA
He acknowledges that “whilst the country is currently benefiting to some degree from improved sentiment towards emerging markets, strong precious metal exports and low oil prices, considerable structural inefficiencies persist”. His is not a lone voice.
Another way of looking at it is that the average South African ought to be 40% wealthier today than they are.
This would’ve had a profound impact on those in poverty as well as on all less affluent households. But to get there, one needs growth.

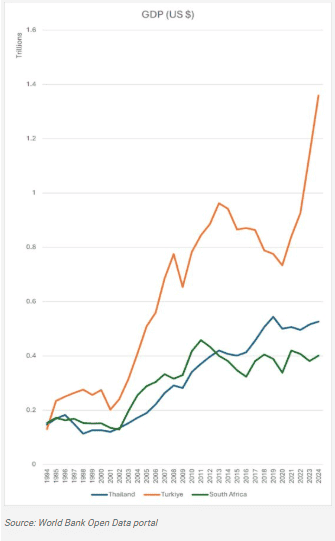
An interesting thought experiment is to compare ourselves with emerging market peers who had similar size economies in 1994. Thailand and Turkiye (then Turkey) had similar size populations then (around 60 million), while we had around 44 million.
ALSO READ: Why is the rand so strong and the economy so weak?
Today, we’re at 65 million (give or take), Thailand is at 72 million while Turkiye’s is nearly 86 million. Sure, these are structurally different economies but services are the bulk of all three (around 60% to 65%, with the importance of tourism and finance common across the countries).
Agriculture and manufacturing are important components for all three (albeit somewhat less so for South Africa), while we over-index when it comes to mining.
The point is that the makeup of an economy is no accident. Much of this comes down to policy and investment choices made 10/20/30/40 years ago.
Thailand overtook us more than a decade ago and hasn’t looked back. Turkey’s economy is more than three times the size of South Africa’s today and more than 2.5 times that of Thailand.

They’ve simply been better at attracting more investment than we have.
ALSO READ: Is volatile geopolitics good for the gold price, rand and JSE?
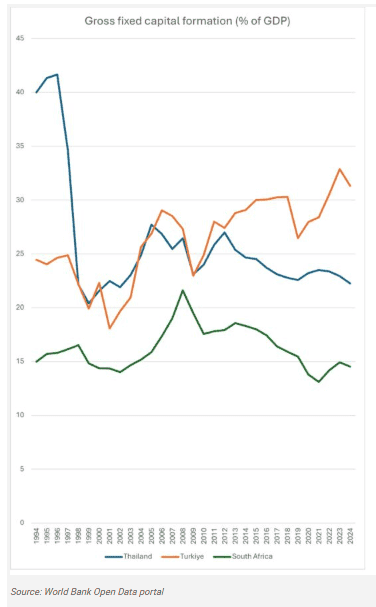
A critical measure of investment is gross fixed capital formation, which counts all new construction, land improvements and equipment purchases by business, government and households.
To hit the magical 3% growth target proffered by government repeatedly over the last decade-plus, we need gross fixed capital formation to be at 18% to 20% of GDP.
The last time we exceeded 20% was in 2008, and we’ve only been in that range in five years of the last 30.
That tells the story.
This article was republished from Moneyweb. Read the original here.